Your inflammation data, always at your fingertips.
Everything you need to understand, track, and act on your inflammation data.
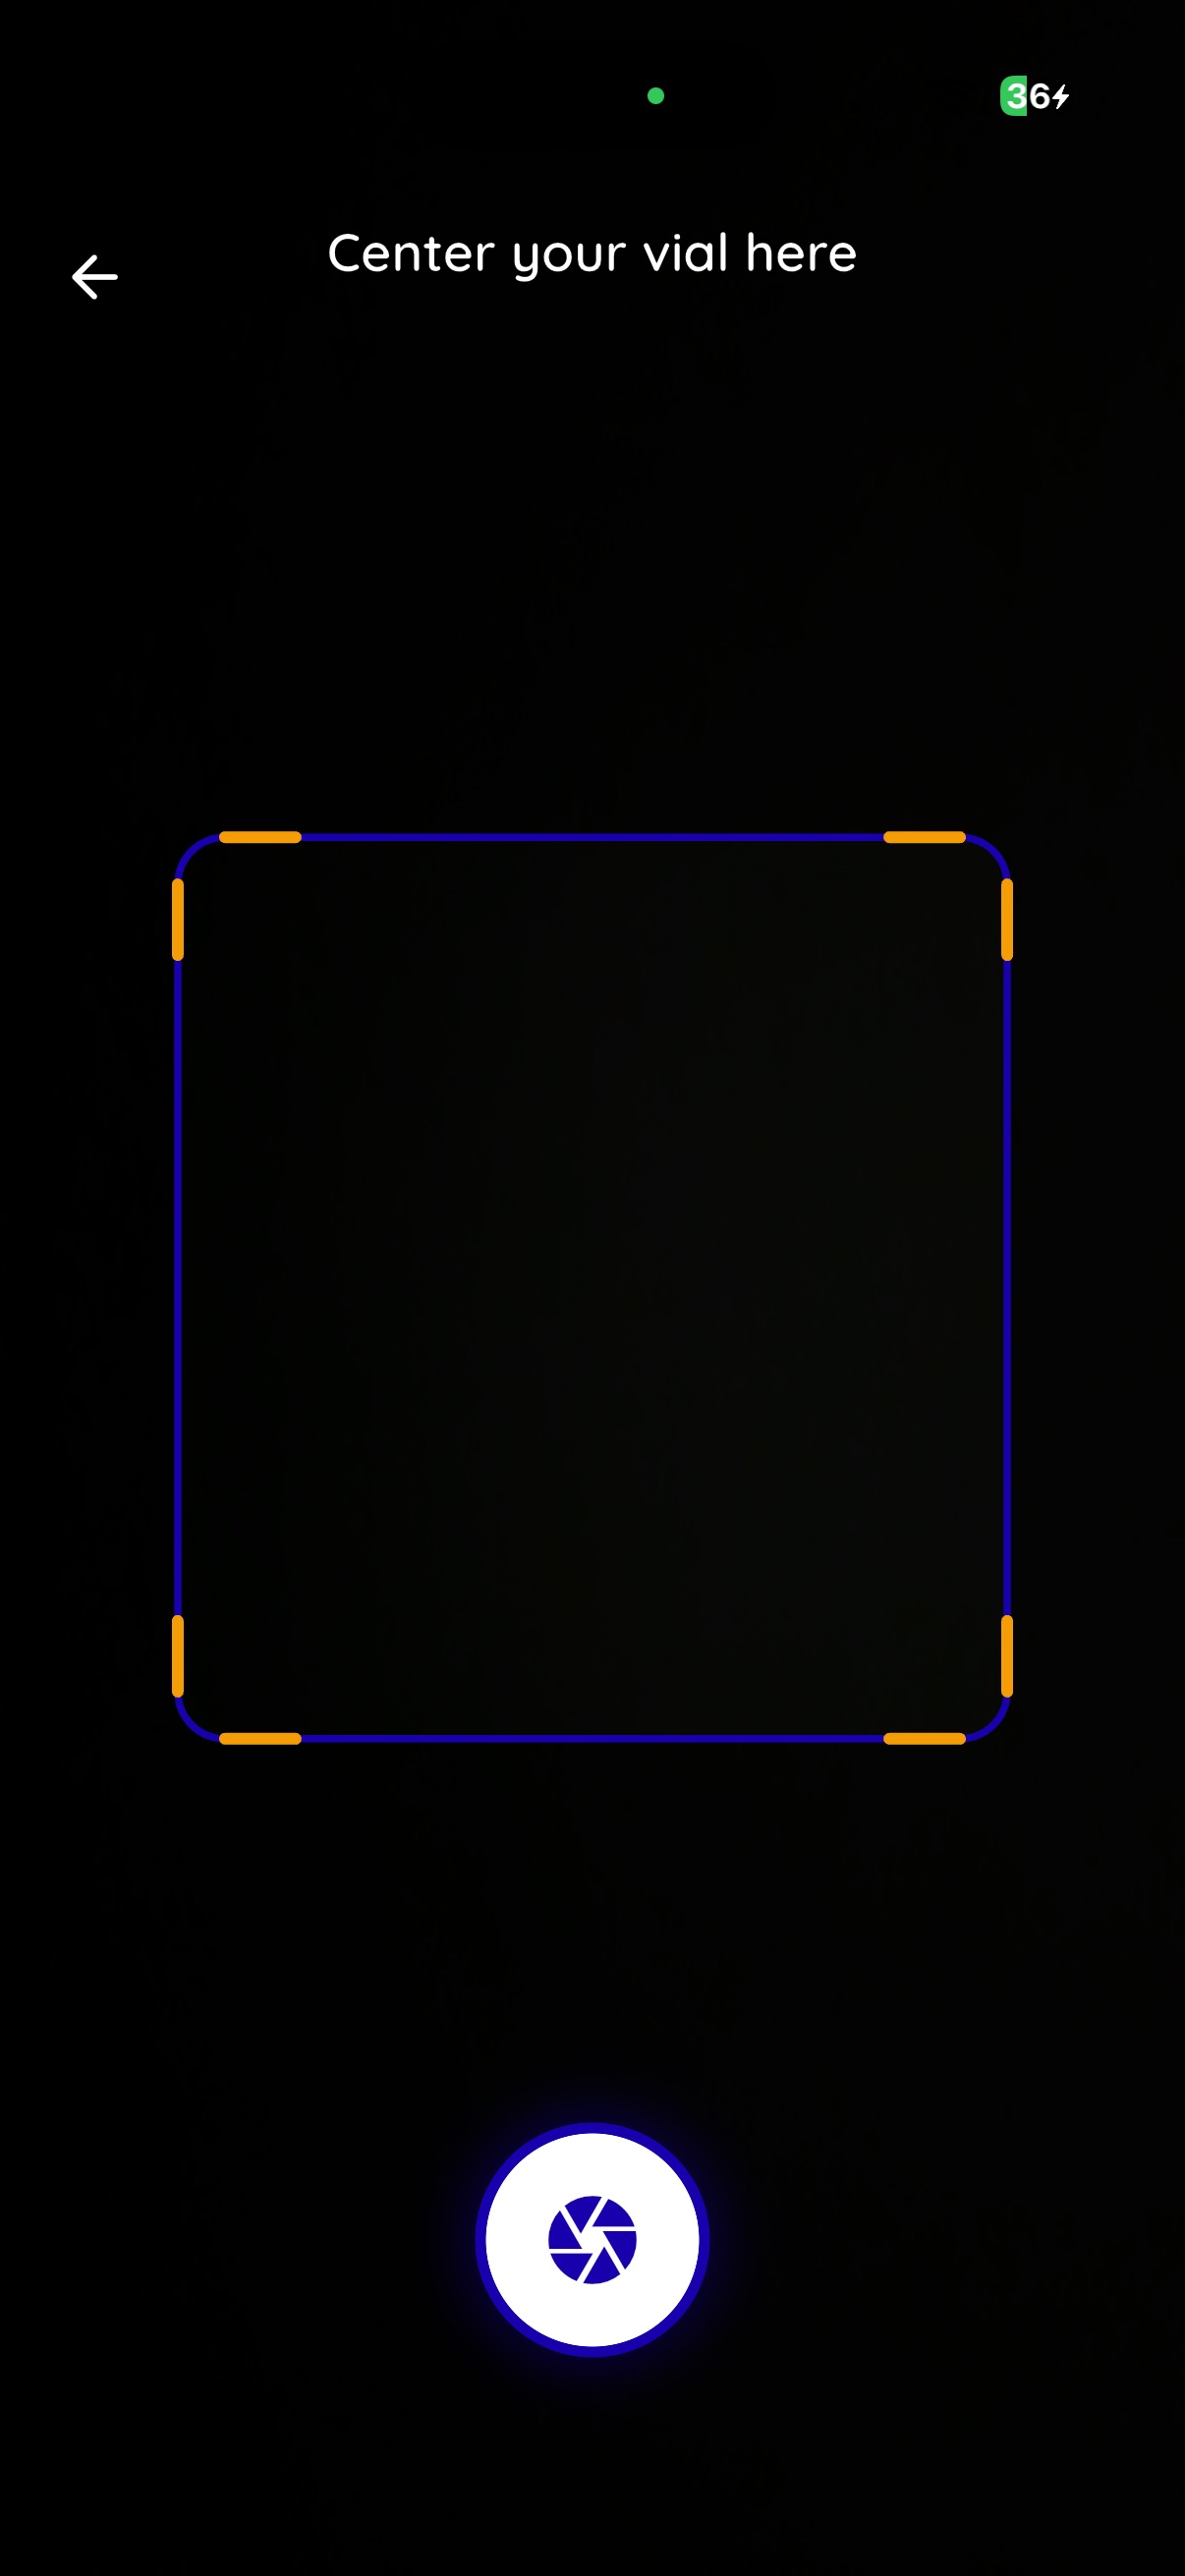
Point your camera at the Sensa vial and hold it steady. The app analyzes the color change to calculate your CRP (C-reactive protein) level in mg/dL and gives you a 0–100 inflammation score instantly.
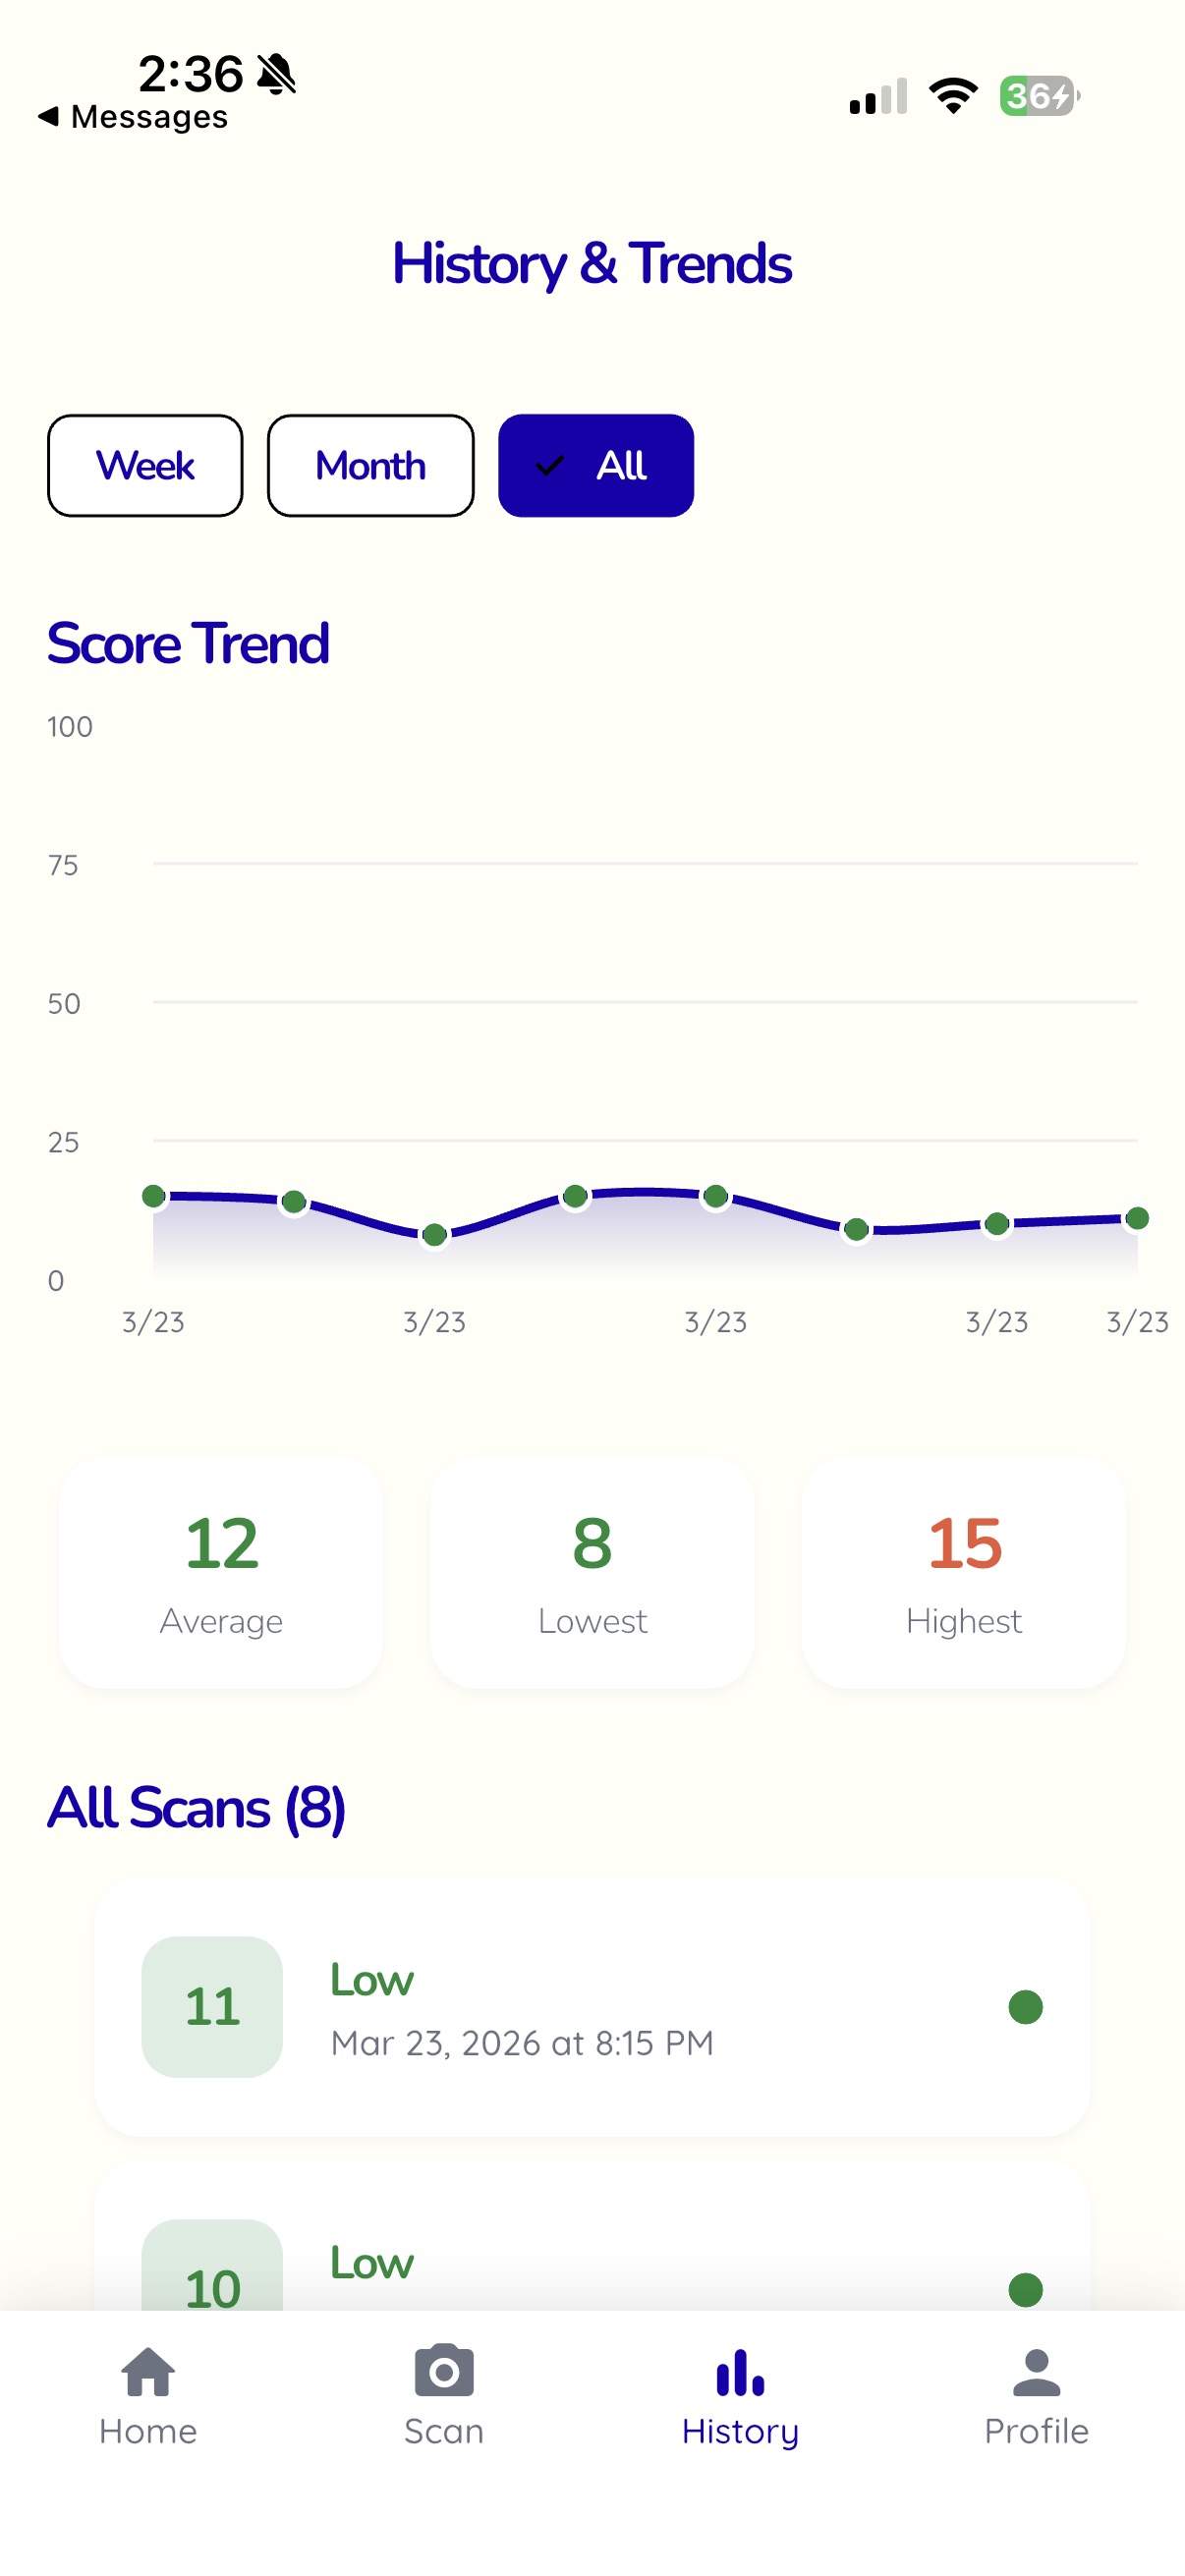
View your score trend with an interactive line chart. Filter by week, month, or all time. See your average, lowest, and highest scores at a glance — and instantly know if you're improving or trending higher.
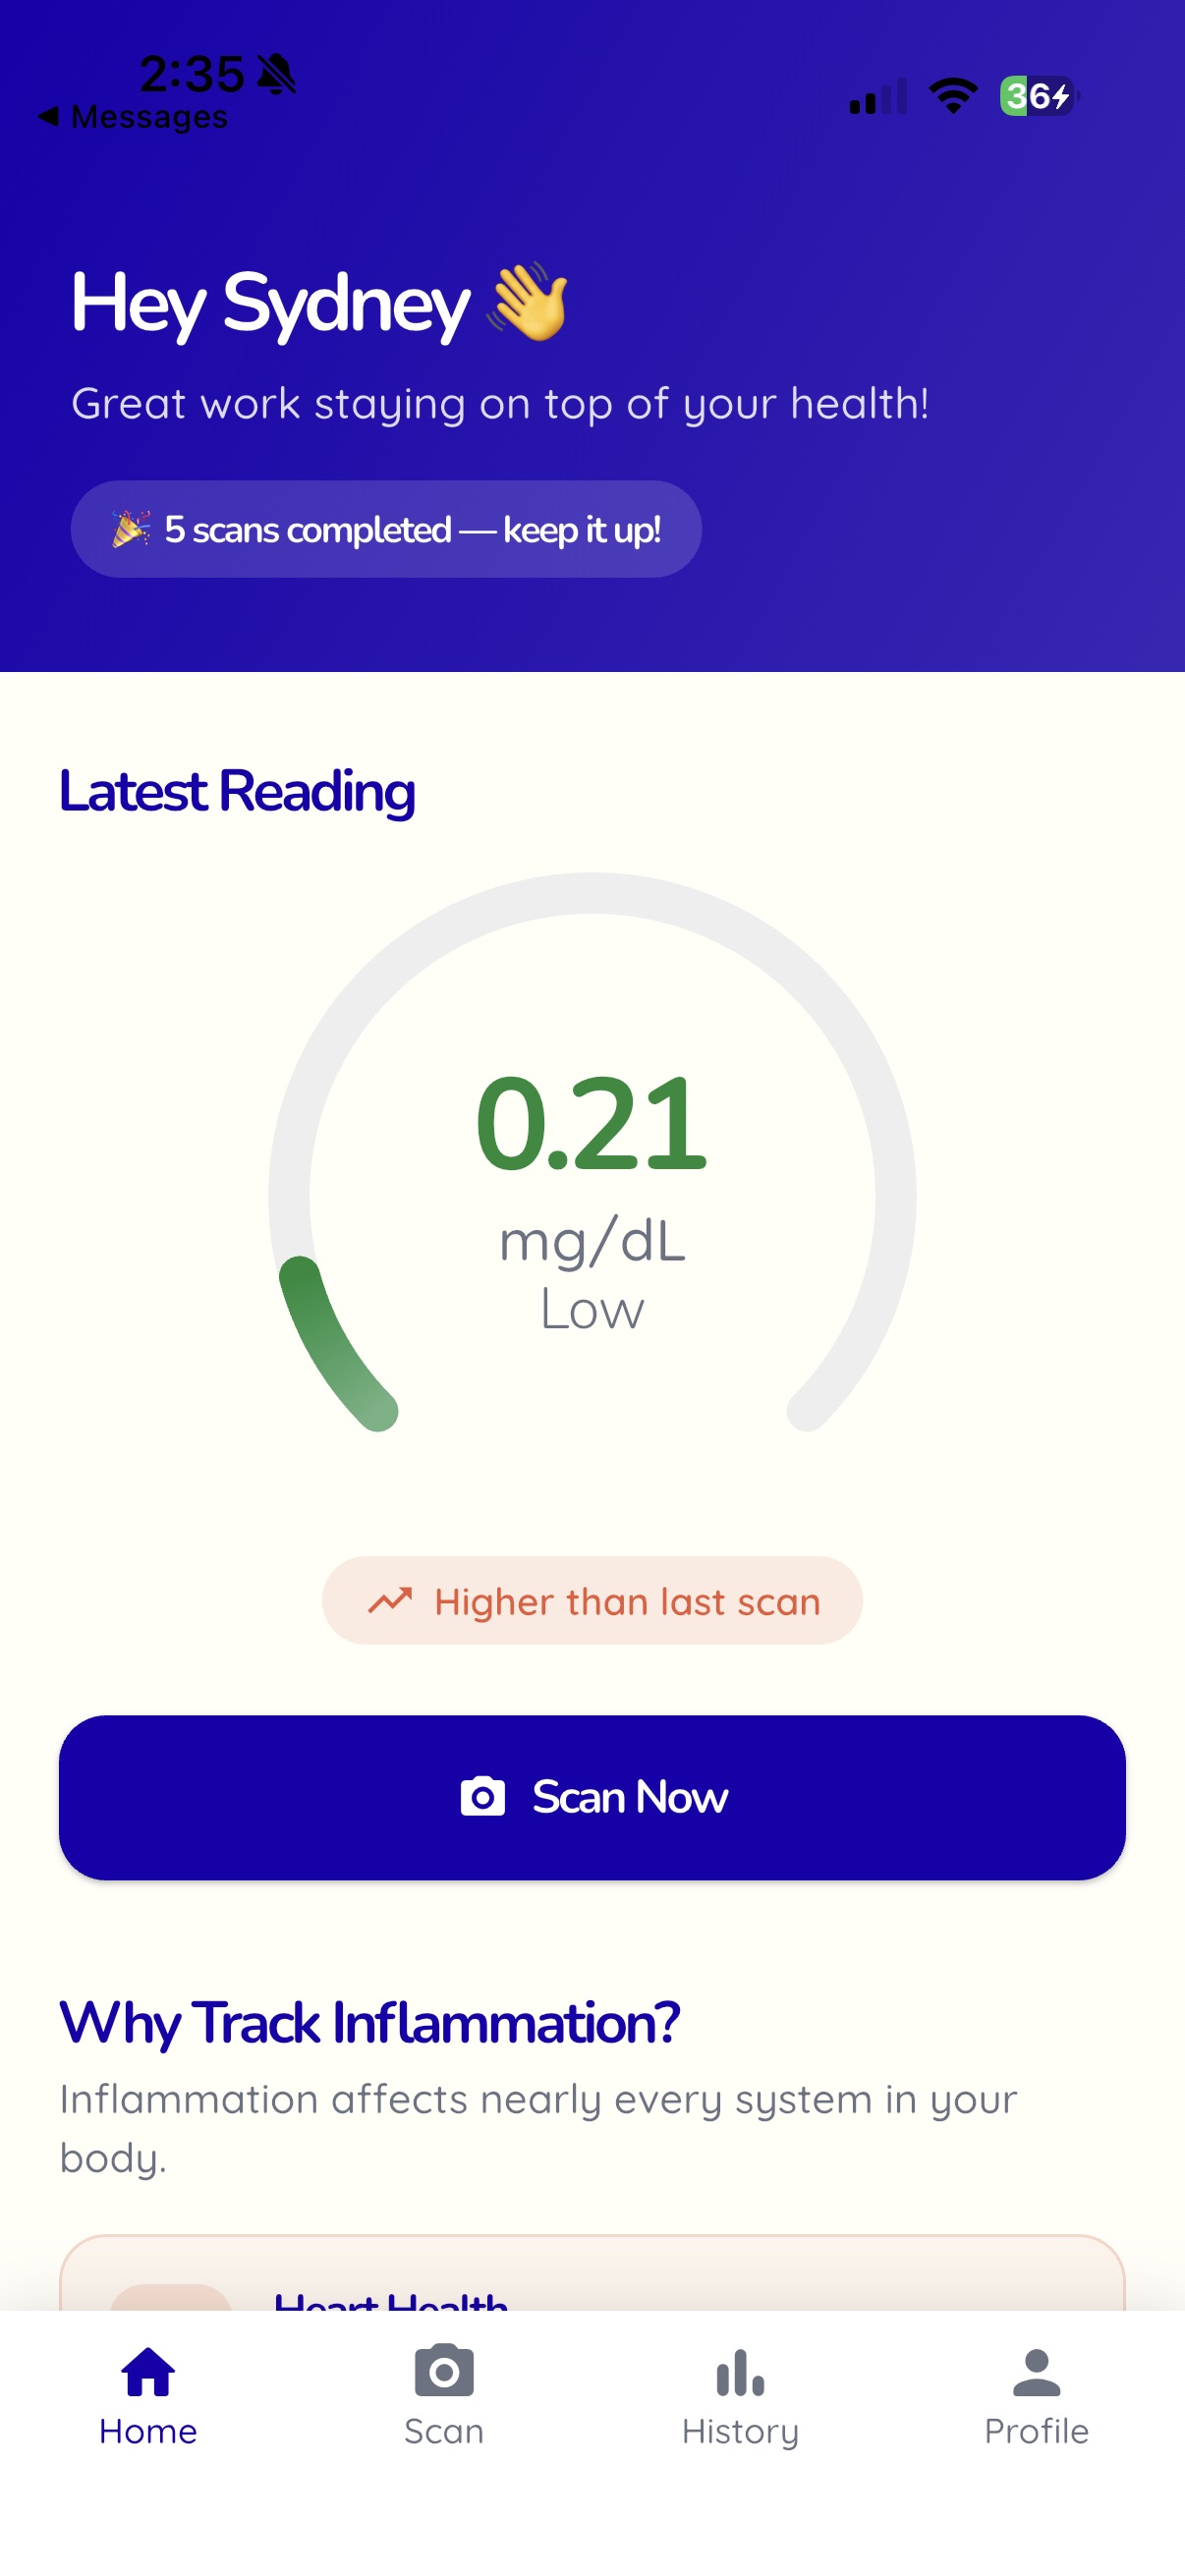
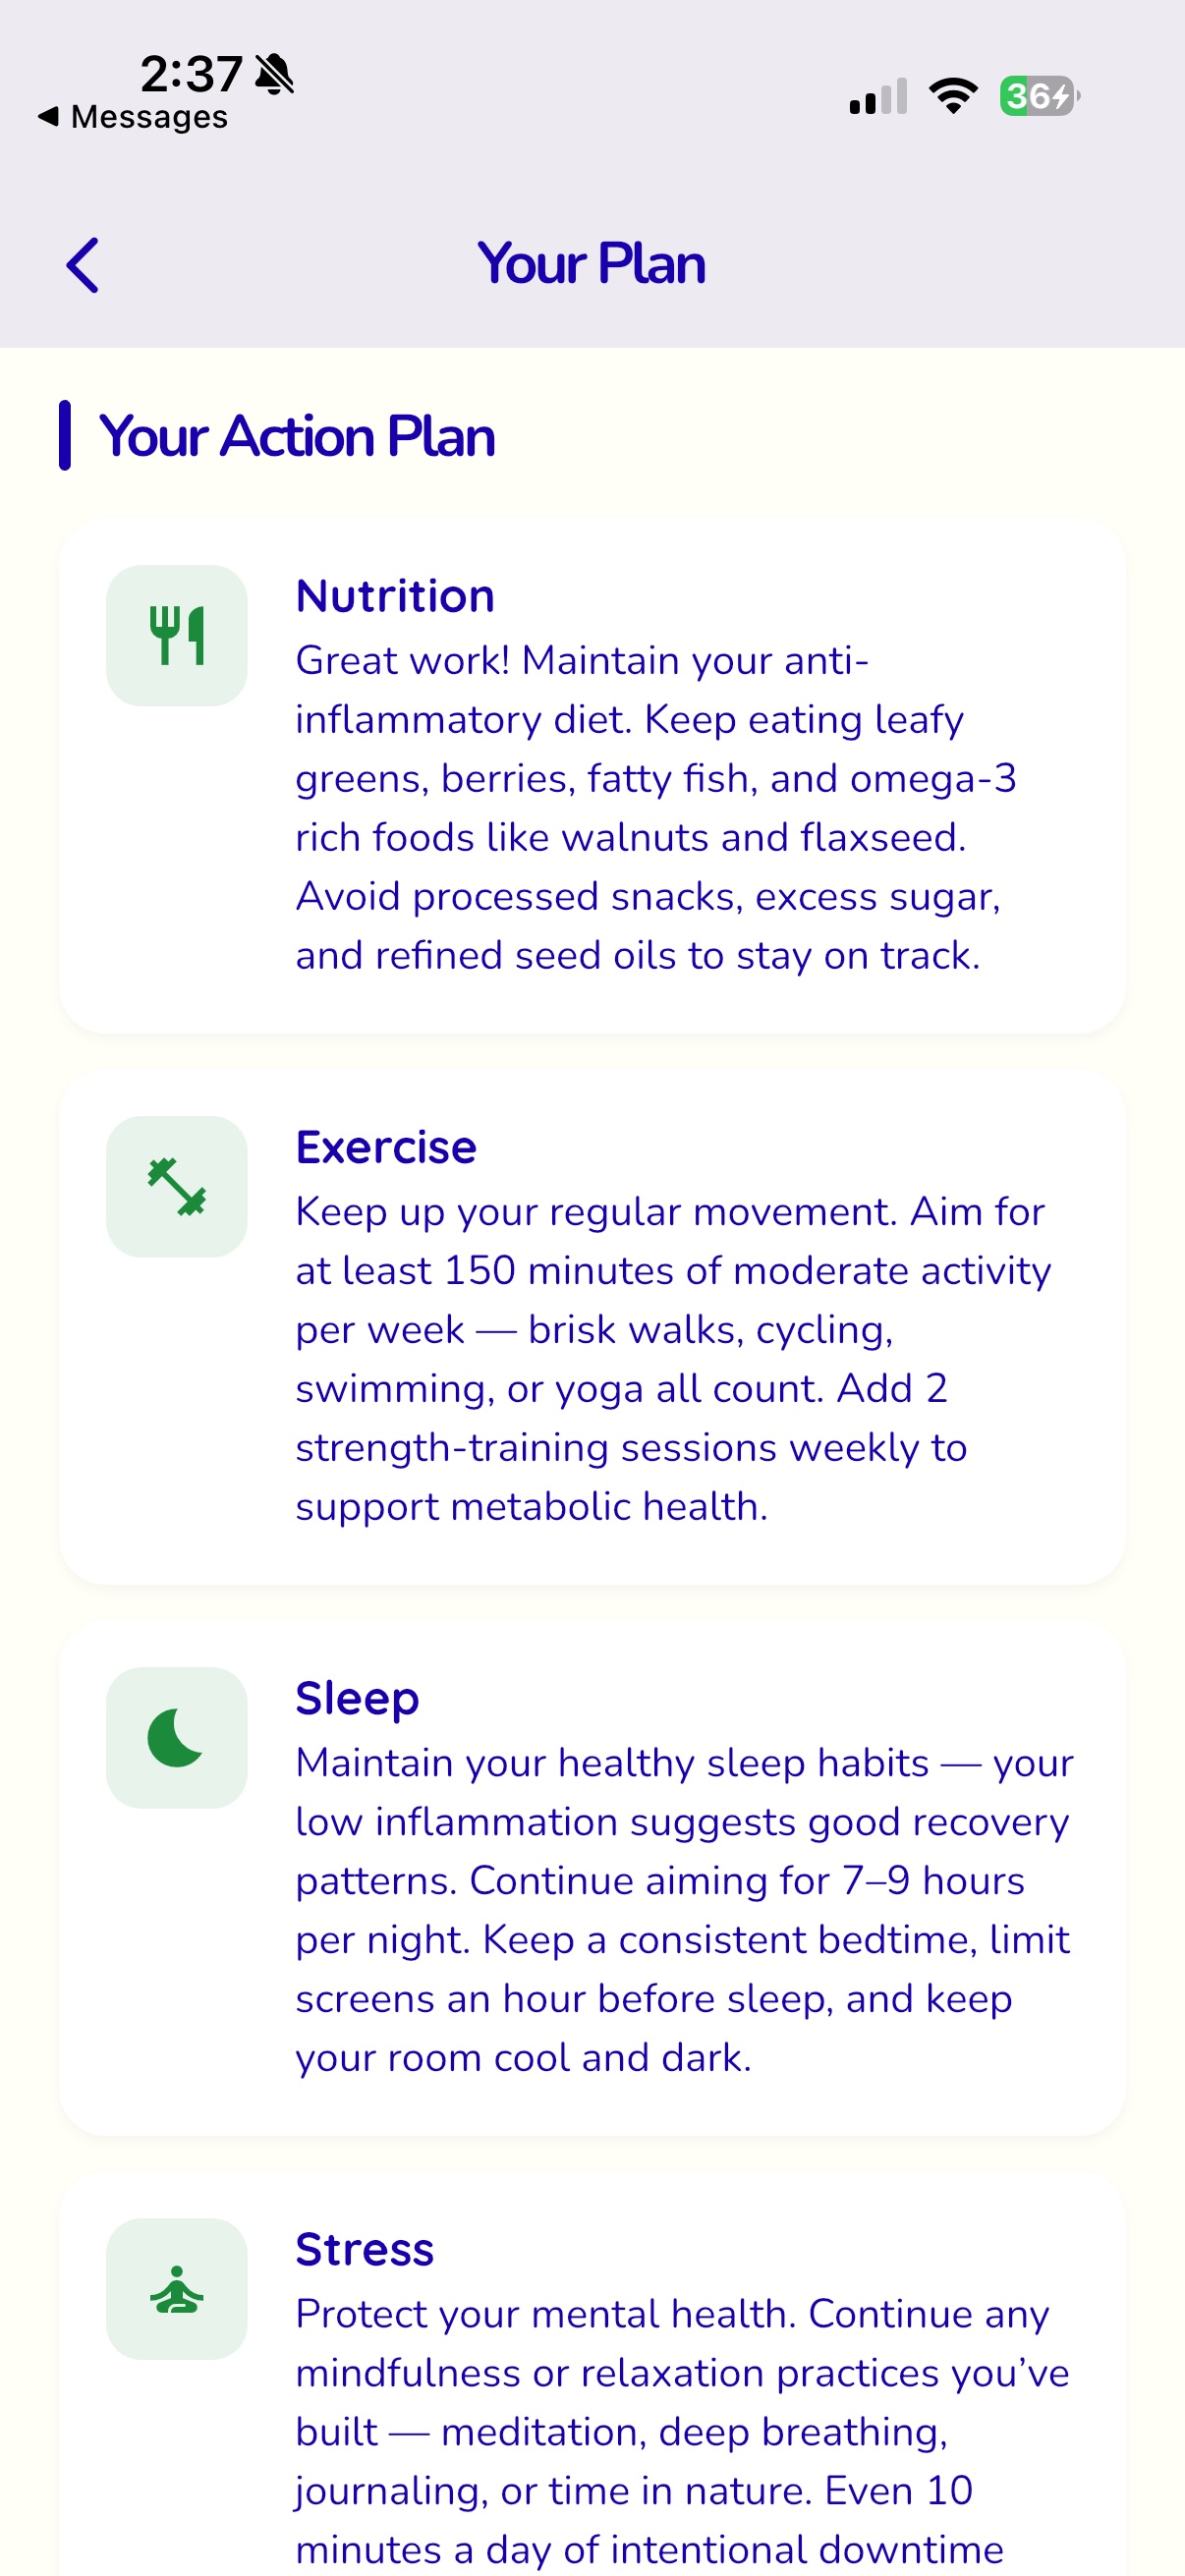
After every scan, get expert-backed recommendations tailored to your inflammation level. Not generic advice — specific next steps based on your actual CRP reading and scan history.
Schedule recurring scan reminders so your data stays consistent. The app sends push notifications at the time you choose, making it easy to build a regular testing routine.
Generate a shareable report of your inflammation history including scores, CRP levels, trend charts, and scan dates — formatted clearly so your healthcare provider can actually use it.
Your scan data is stored securely in the cloud and tied only to your account. You can delete any scan or your entire history at any time — your health data belongs to you.
The Sensa app turns a simple color change into actionable health intelligence.
Open the app and hold your Sensa vial steady in the camera frame. Tap Scan Now.
The app measures the blue channel intensity of the vial to calculate your CRP level in mg/dL and converts it into a 0–100 inflammation score.
See your score, track your trend vs. your last scan, and get a personalized plan. Every result is saved to your history automatically.
A closer look at the actual Sensa app experience — from your home dashboard to scan results.
Be among the first to experience the Sensa app. Join our waitlist for early access.
Buy Now